From OpenSCADAWiki
UI.WebVision
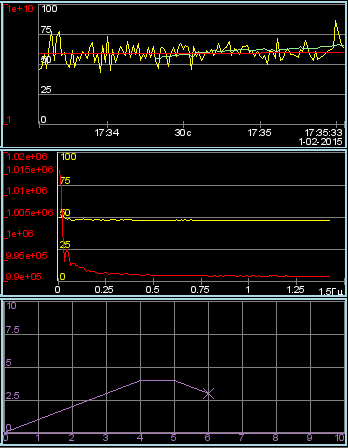
The diagrams construction element releases for types: "Graph", "Spectrum" and "XY", with properties:
- General properties of the diagram types "Graph", "Spectrum" and "XY":
- possibility to select the archiver, the archive buffer or all their, at working with the archiving data;
- adaptation of the parameter graph to real data values by adjusting the scale, in the absence of a directly specified range of values;
- controlling by axis ranges in way increasing, decreasing and shifting;
- wide range of scaling and adapting the time axis with automatic fitting the requested data to quality pretty for imaging, or needed for export — specifying the maximum number of measurements per pixel;
- imaging dimensional grid and markers in horizontal and vertical with adapting to the imaging range;
- tracing mode of the current time by periodically updating and shifting the time of the diagram to the current time — the time of the last data in the archive buffer.
- Properties of the diagram type "Graph":
- constructing graphics up to 100 parameters per diagram in a percentage scale and displaying the selected parameters in its own scale;
- constructing graph for: current, archiving and users data;
- forming of an intermediate display buffer for current values;
- support for the active mode with cursor and getting values under the cursor;
- possibility of construction graphics as into both linear and logarithmic scale of the values.
- Properties of the diagram type "Spectrum":
- construction of graphics of the frequency spectrum of parameters up to 100 on one diagram in a percentage scale and the ability to display selected parameters in its own scale;
- constructing graph for: archiving and users data;
- support for the active mode with cursor and getting values under the cursor;
- Properties of the diagram type "XY":
- construction of XY graphs of parameters up to 50 on one diagram in a percentage scale and the ability to display selected parameters on its own scale;
- constructing graph for: current, archiving and users data;
- forming of an intermediate display buffer for current values;
- the parameters distributed by pairs at one graph, where paired by axis Y (0,2,4...) and unpaired by axis X (1,3,5...);
- possibility of construction graphics as into both linear and logarithmic scale of the values.
Figure represents a part of the screen with the frame containing examples of the diagrams: "Graph", "Spectrum" and "XY".
